Streamflow vs. Water Inflow Maps

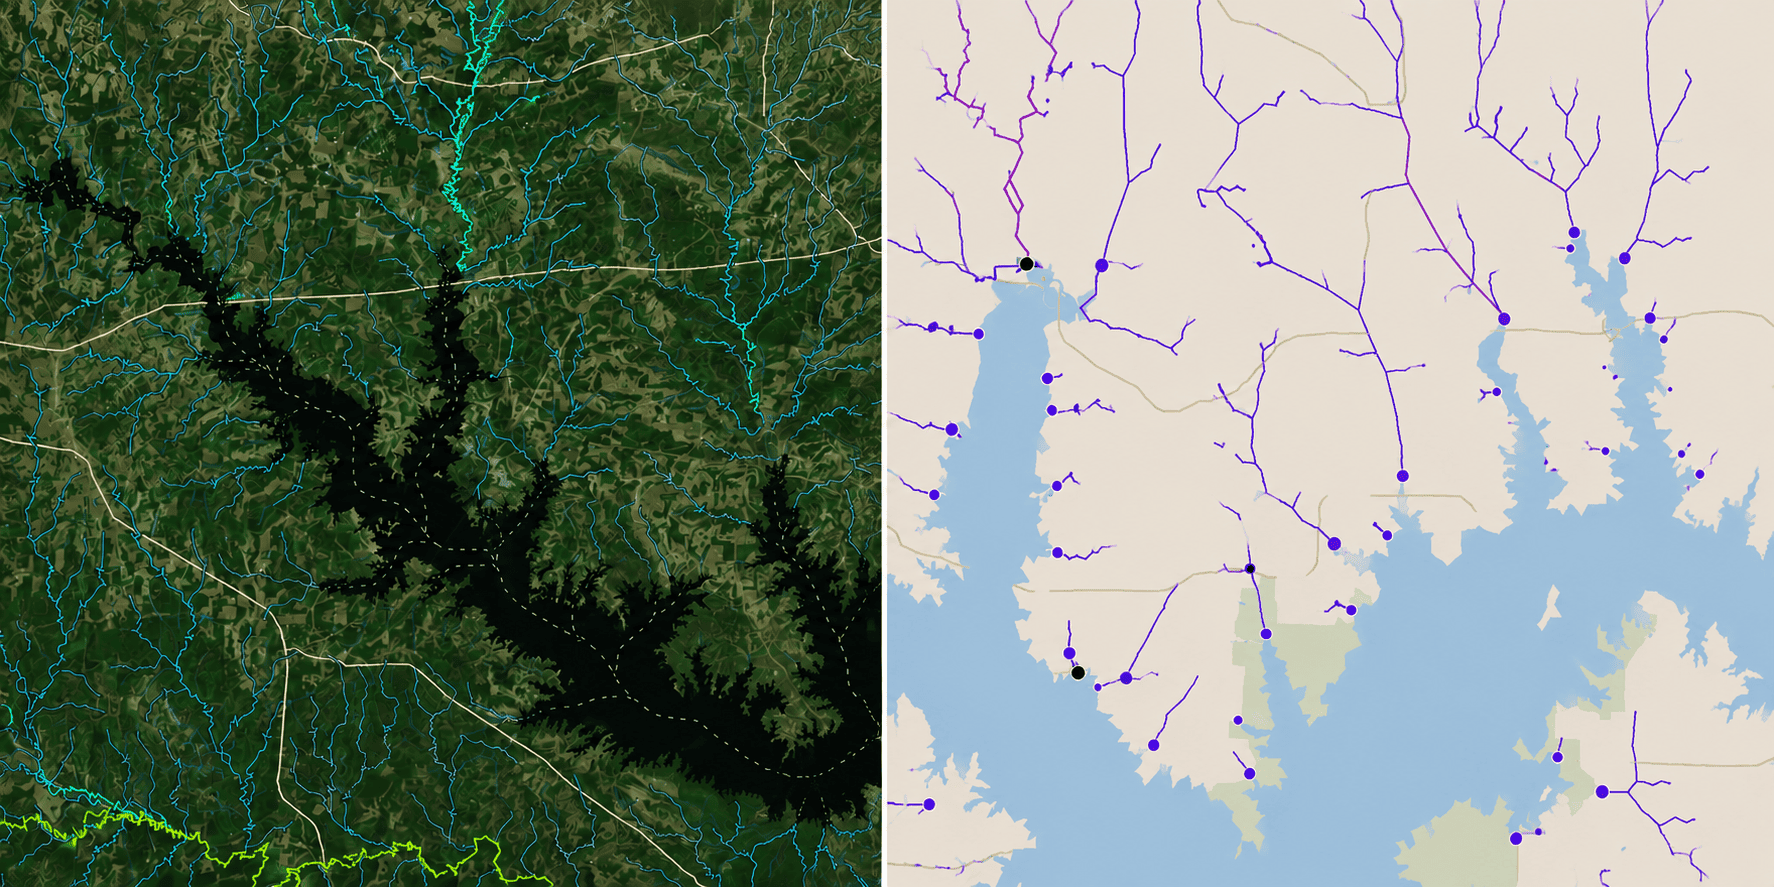
A usual question anglers have about Deep Dive’s suite of tools is the difference between the Streamflow maps and the Water Inflows maps. Both maps look similar, with both showing where water flows into a lake or reservoir.
The difference between the two is Streamflows are fed by a constant or continuous water source, while Water Inflows are more like funnels that shed intermittent rainfall into the lake.
Put another way, Streamflows are true tributaries cataloged as constant water sources that rarely go completely dry and always have a flow. On the other hand, inflows are essentially dry creek beds or “seeps” that only run water in the event of rainfall.
Streamflows generally run for miles before entering a lake. Inflows have a much shorter path down a hill, which terminates into the lake as a run-in or even a small waterfall. They may completely dry up if sufficient rainfall does not keep them flowing.
When to Use Streamflow Maps
With that, the question becomes: when to use the Streamflow maps versus the Water Inflows maps?
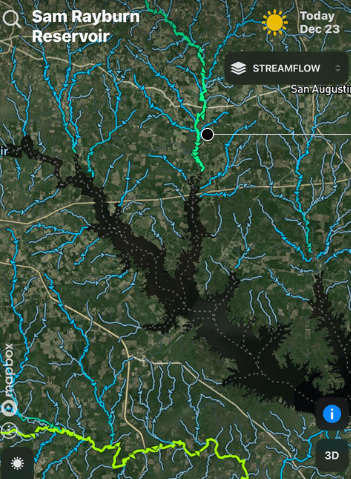
Always start with the Streamflow maps because this tool provides so much information about how much flow is entering and leaving a lake. The Streamflow maps will only show the true tributaries pouring into a lake. These include dominant flows such as the main river, primary creeks, and persistent tributaries.
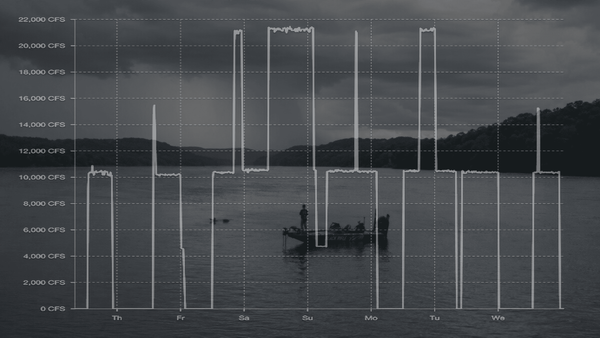
On the Streamflow maps, these tributary flows are indicated with blinking, colored arrows, showing the direction and magnitude of the flow. Zoom in on the map to where the arrow indicators enter the lake. The arrows are clickable, allowing the user to bring up real-time hydrological flow rates in cubic feet per second (CFS). The flow rates are presented in a chart form over nine days total, including the historical flow rate of the previous two days, and the predicted flow rate of the next seven days. Also included is the long-term historical average flow rate for that tributary, which is an excellent reference point.
Comparing Creek Flow Rates and Conditions
For any given lake, it’s well worth the time to scroll around and explore flow rates of multiple creeks to see how much flow each creek is capable of producing. Knowing which creeks are high-flow creeks and which ones are low-flow creeks unlocks a lot of valuable information as to why one creek is better than another creek in different conditions.
Creeks with high-flow rates tend to bring in more fertility and water color for more robust baitfish populations. However, if there has been a lot of rain, a high-flow creek might be blown out with too much fresh, muddy water, and a low-flow creek would be better for more stability.
The value of Deep Dive’s Streamflow maps does not stop at just the lake, either. Users can also zoom out and follow tributaries from the lake back to where they originate. A creek or river may run some 20 to 40 miles through the flatlands, foothills, or mountains. And Deep Dive’s mapping shows it all: where the water source originated and what other rivers and creeks joined it along the way. Yet, here is the real beauty of the Streamflow tool: you can see the hydrological graph readings for the entire length of a creek or river. A 20-mile-long stretch of river may have 10 different hydrological readings along its course, and you can access each one on the Streamflow map. Just keep following the Streamflow arrows and click on them at different points to see different readings along the tributary. This allows users to see how and where tributaries pick up water along their route to build flow.
Tracking Water Movement and Dam Pulses
Perhaps a big rain occurred 40 miles away in the mountains. How long will it be before all that water gets to your lake? Which portions of your lake will be affected the most? Which ones will be affected the least? You can literally follow the “slug” of water headed your way on the Streamflow map to see when and how it will impact your lake.
Other unique tangents revealed by the Streamflow tool are the “pulses” of water that result from dam generation. There are thousands of small, obscure hydroelectric dams throughout the country generating power a few times a week. Oftentimes, those dams generate in cycles, creating sneaky pulses of water that can be a few thousand more CFS than the normal flow. These generation “waves” or “pushes” stay together as they travel miles down a creek or river and enter a lake, providing a few hours of “mystery current.” Bass get conditioned to these fresh pulses and feed during them like incoming tides.
Understanding Water Inflow Maps
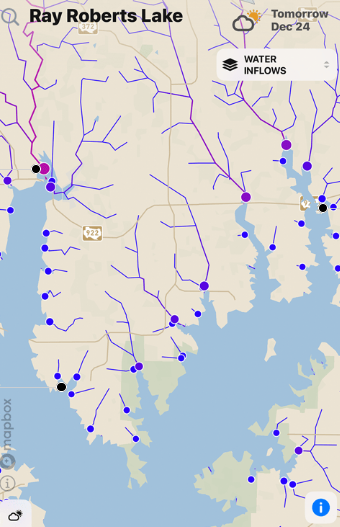
As for the Water Inflows map, it is essentially a Streamflow map with dozens of dry stream beds layered over it. If you toggle back and forth between the Streamflows map and the Water Inflows map, you’ll notice that the Streamflows map shows only primary tributaries with consistent water flow, whereas the Water Inflows map includes dozens of other small seeps that shed rainwater as inflows.
In general, there are far more Water Inflows in highland or foothill lakes than in lowland impoundments or natural lakes. Also, Water Inflows require consistent rainfall to keep them flowing. For that reason, they are big players in the summer and early fall when thunderstorms, tropical systems, and early fronts can revive Water Inflows with ample rain giving bass another feeding option.
Scrolling around and observing different Water Inflow sizes and sources is another way to stack the fishing odds in your favor. The fetch of dry stream beds can be as short as 100 yards or as long as a couple of miles. Some originate as small lakes or tiny farm ponds. Some Inflows bring warmer water in the winter, while others bring cooler seeps in the summer. Deep Dive even has a filter on the Water Inflows map that allows the user to see smaller inflows or larger inflows.
Using Streamflow and Water Inflows Together
Whether you are looking to learn more about your local lakes or lakes you have never fished before, the benefits of scrolling around on the Streamflows map and Water Inflows maps are immeasurable. Knowing each flow’s origination, length of travel, and strength of flow are critical pieces of information that ultimately impact bass behavior. With each change in these flows, the whole ecosystem shifts, and Deep Dive is the only fishing app that allows you to keep up with all water-flow changes at one time.