Jordan Lee’s favorite Deep Dive features

Two-time Bassmaster Classic winner Jordan Lee is known for utilizing current conditions instead of milking a bunch of historical areas on a lake. He remembers when keeping up with such current conditions required a lot of time and resources.
“We used to put sticks in the ground at the waterline, or rocks out at the ramp to measure the water level change each day,” Lee recalls. “We used to stop at various river channel buoys throughout the day to try to determine how hard the current was running. We would have to run around an entire lake to see what the water color looked like, which was costly.”
“It was quite an effort to try to figure out all those variables the hard way,” Lee says. “Now it’s all right there on the Deep Dive app on my phone. It’s pretty amazing, actually.”
Deep Dive’s Real-Time Data Tools
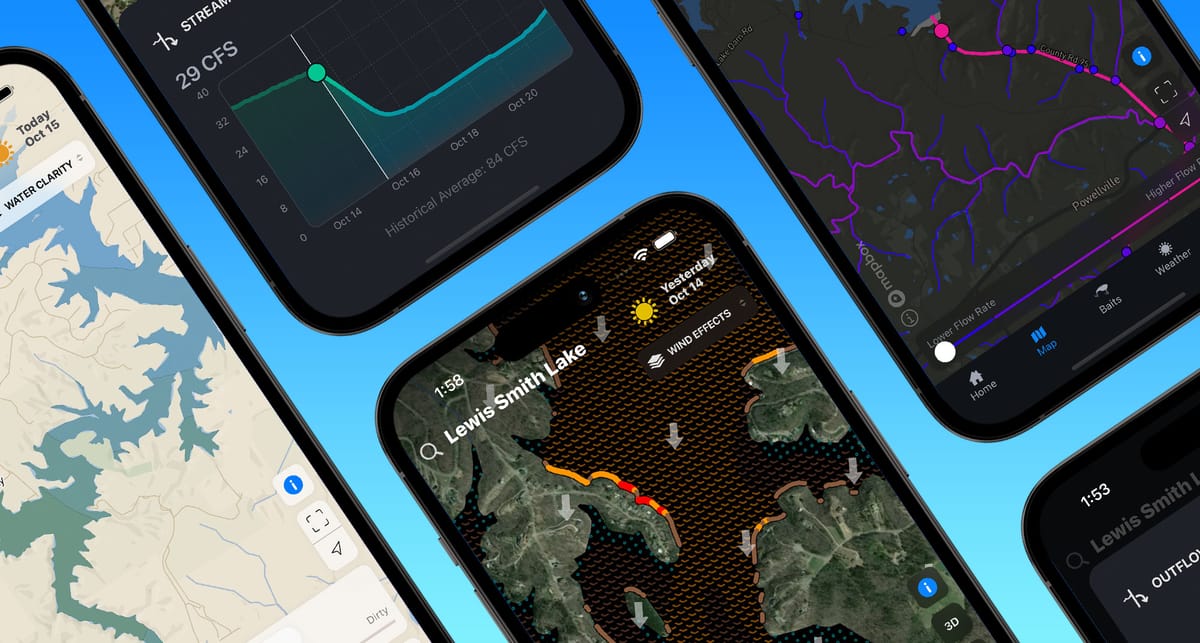
Deep Dive’s collection of real-time data tools for most major lakes across the U.S. is pretty extensive, especially since it’s all under the roof of a single app. Currently, Deep Dive offers a unique blend of eight types of real-time conditions, including weather; water level; amount of current flow moving through a lake; detailed wind influence on a lake based on wind speed, direction, and fetch; water color changes across a lake; amount of current flowing into major creeks; location of every inflow where water historically enters a lake; and the ebb and flow of tides for certain tidal fisheries.
Most of this information is real-time data, but what makes Deep Dive even more impressive is that many of these individual data tools also include a sliding time scale, which allows users to scroll back in time for a historical perspective of a particular condition. Some even have forward sliders to provide a forecast of the condition.
More specifically, here is a breakdown of how far in time a user can scroll for each data layer:
- Weather: 7 days ahead
- Water level of a lake: 30 days back
- Amount of current flow exiting a reservoir at the dam, often referred to as how much current is being “generated”: 30 days back
- Wind Effects map in terms of how the speed, direction, and fetch of wind create waves and the varying degree to which those waves impact banks receiving the wind: 2 days back and 7 days ahead
- Water Clarity map showing the different levels of water color throughout a lake: 30 days back
- Streamflow rates of large secondary tributaries that contribute flow to a lake, such as large creeks: 2 days back and 7 days ahead
- All inflow drainages into a lake, including dry creek beds that only flow in the event of rain. The inflow map has no scalable history; instead, it shows the multiple points where water enters the lake with temporary rainfall. The inflows are color-coded based on how much water each inflow collects over distance
- Tides graphics show how the high-tide “wave” and low-tide “trough” move in and out of a large bay complex: 2 days back and 2 days ahead
Essentially, these time-scale sliders allow the user to go back in time over the past few days to see how the conditions have changed. Has the lake level come up or gone down? What time is most of the current being “pulled”? Which banks have been receiving the most wind, and which banks have been the calmest? Which stream flows have been running the hardest, and how has the water color been moving down the lake?
Jordan Lee’s Favorite Deep Dive Feature
When asked about his favorite function of Deep Dive, Lee was quick to point to these time scales and the historical perspective they provide.
“Being able to scroll back and see the track of certain conditions over the past few days is a big deal for me,” he says. “That’s what tells the real story of a current condition and how it has impacted the lake over the last several days.”
Lee will use two or three different data tools and scale them out over time to see how they intermix to create conditional bite windows.
“When I get on TVA lakes, generation and current flow are huge factors,” he explains. “To see when the high and low points of generation are happening on a graph over the last few days is key information. If I can time the higher flow generation times with a wind blowing in the same direction as the current, it helps sort of compound the conditions in my favor; I am maximizing that window with current conditions.”
Lee says the opposite is true as well. If there is a light current period during the day, and the wind is blowing hard against the current, negating it to some degree, fishing time is best spent elsewhere in more favorable conditions.
“I think the real power in Deep Dive lies in being able to line up a couple of different conditions in your favor simultaneously,” he adds.
When asked what his favorite tool is on Deep Dive, Lee reveals he really enjoys the Water Inflows map. Since he lives near Smith Lake in North Alabama, a highland impoundment banked by steep terrain, fishing “run-ins” is one of his favorite conditional patterns. He says the Water Inflow information can be lethal on any highland impoundments, where water sheds from surrounding terrain.
Smith Lake literally has hundreds of water inflows that range from dry, short, hidden stream beds to creeks that run for miles, and everywhere in between.
“Smith is known for having a lot of sneaky run-ins,” Lee says. “Some of them you literally can’t see, you’ll just hear water running down a little crevice into the lake. Since using the app, I’ve had fun playing around with those run-ins to make sure I haven’t missed any.”
“It’s actually too good,” he says with a grin. “There are a couple of really good run-ins that I wish I could remove from the app. And I’m going to leave it at that; I’ve already said too much.”