How to Avoid a Creek Blowout

If you have fished tournaments for any length of time, you might be able to relate to this scenario.
During practice, you find your best fish in a main creek arm, far up the lake. The area is a long way from the official ramp, but it contains bigger fish and is far less pressured. You also find a few areas down the lake holding fish, but they’re not as big.
Tournament day has dawned, and it’s time to make some gametime decisions. The long run for the bigger fish is the obvious play, but during practice, a big front rolled in, dumping rain for miles across the lake’s drainage basin. What if the productive creek arm “blows out” with a sudden influx of cold, muddy water?
Oh no! Not the dreaded blowout! The sudden demise of best-laid plans.
Should you make the long run only to find your best area is now the color of a plowed field? Or play it safe, fish closer, and start the event with a conservative limit? If only there were some way to know what kind of impact yesterday’s weather had on your best water today.
Here’s the good news: the Deep Dive app can help you avoid a blowout.
In this particular scenario, the simplest way to check the status of a creek’s incoming water color is to look at the Water Clarity Map for that lake. Blowouts are obvious on the Water Clarity Map, as the back ends of creek are colored dark brown. However, sometimes it might take the Water Clarity feature a day or two to render a Water Clarity map after a rain event.
Using the Streamflow Map to Predict a Blowout
Fortunately, Deep Dive offers another fast and expedient way to determine if your best creek is getting blown out: the Streamflow Map. To fully harness the power of the Streamflow Map, the user must uncover another critical layer that some users may not know about: the Streamflow Graph.
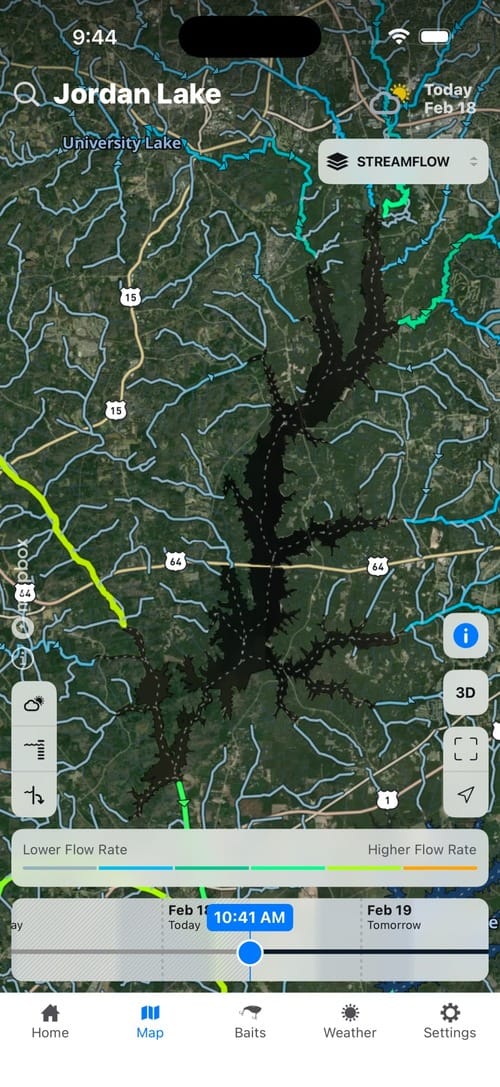
To find Streamflow Graphs, go to the Streamflow Map of a lake. Zoom into the back of the creek arm or tributary you are interested in and find the blinking directional arrows of the current flow coming into the creek. The Streamflow indicator will vary in color depending on water flow strength. Some think this is the extent of the Streamflow Map. However, by clicking on the Streamflow arrows, a Streamflow Graph will pop up, revealing some more crucial information.
How to Read the Streamflow Graph
The graph shows the real-time water flow in cubic feet per second. More importantly, it also shows the water flow rate of the two previous days, as well as the predictive water flow of the next seven days, all in a graphic form.
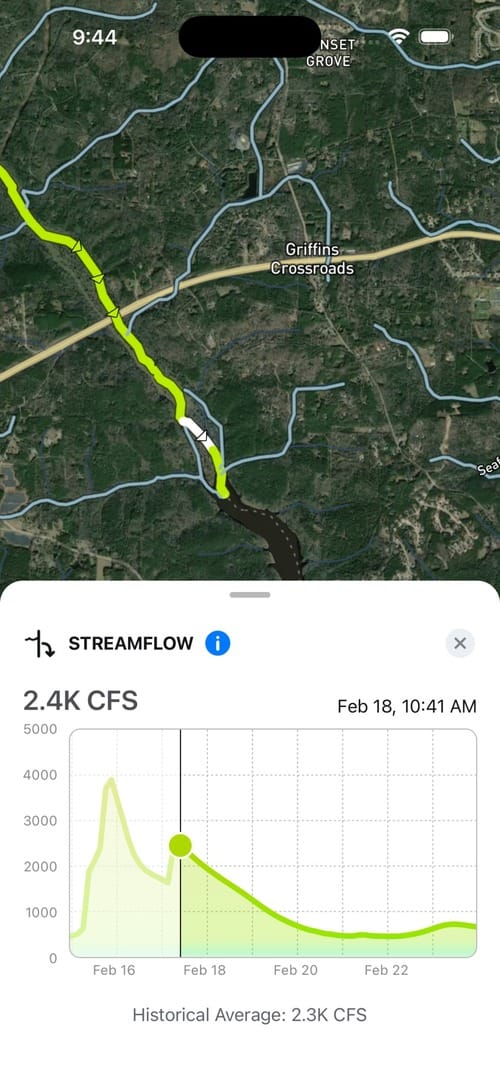
This is an amazing tool in helping anglers know how a recent rainfall is going to impact each creek or tributary in the form of water flow pouring into the creeks. If there is a sharp spike in the Streamflow Graph coming in the next few days, fishing is probably good now, but might crater when the spike hits, bringing cold, muddy water.
The trick to reading the Streamflow graph is all relative to how high the spike goes and how long it lasts. If the creek is running at 10 CFS and it’s only going to peak out at 20 CFS the day after a rain, then it’s likely the creek will not be blown out. However, if it’s predicted to suddenly shoot up to 100 CFS for a couple of days, a blowout is imminent.
In general, the smaller and less prolonged the spike is, the less likely a full blowout will occur. Water flows that don’t double in volume are usually fine. But ones that predict five times – or more – additional water flow could be a problem.
Blowout potential is also very dependent on the terrain and substrate of the geographic area. Lowland impoundments surrounded by hills of clay, silt, and soil are more likely to blow out than highland rock-based impoundments.
Years ago, it was impossible to know how much an inch of rain would impact creeks and tributaries. Only locals knew these shifting variables from experience, which gave them a huge advantage.
These days, technologies like Deep Dive’s Streamflow tool can arm anglers with information to help them make better-informed decisions – and avoid a blowout.